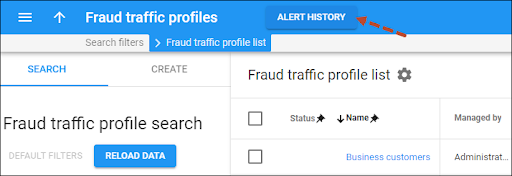
Use this panel to find a specific alert. Specify one or more search criteria and click Apply filters. To reset the search criteria, click Default filters. To refresh the search results, click Reload data.
Type
Link copied to clipboard
Filter alerts by the entity they relate to. Select the needed type from the drop-down list:
- Any – all available alerts.
- Customer – alerts generated when a specific customer exceeds the threshold set on the Service usage monitoring panel. Choose a specific customer in the Customer list.
- Reseller – alerts generated when a specific reseller’s customers exceed the Service usage monitoring threshold. The threshold is set within a fraud traffic profile assigned to the reseller. Choose a specific reseller in the Reseller list.
- Customer class – alerts, generated when customers of a specific customer class exceed the Service usage monitoring threshold. The threshold is set within a fraud traffic profile assigned to the customer class. Choose a specific customer class in the Customer class list.
Complete destination group set
Link copied to clipboard
Filter alerts by the complete destination group set.
Destination group
Link copied to clipboard
Filter alerts by the specific destination group within the complete destination group set.
From/To
Link copied to clipboard
Filter alerts by the period when they were generated. Click Calendar to select the date and time or type it in the “yyyy-mm-dd hh:mm” format (2019-03-19 00:00).
To clear the selected date, click Cancel .
By default, PortaBilling shows alerts made during the recent 24 hours up to the present moment.


