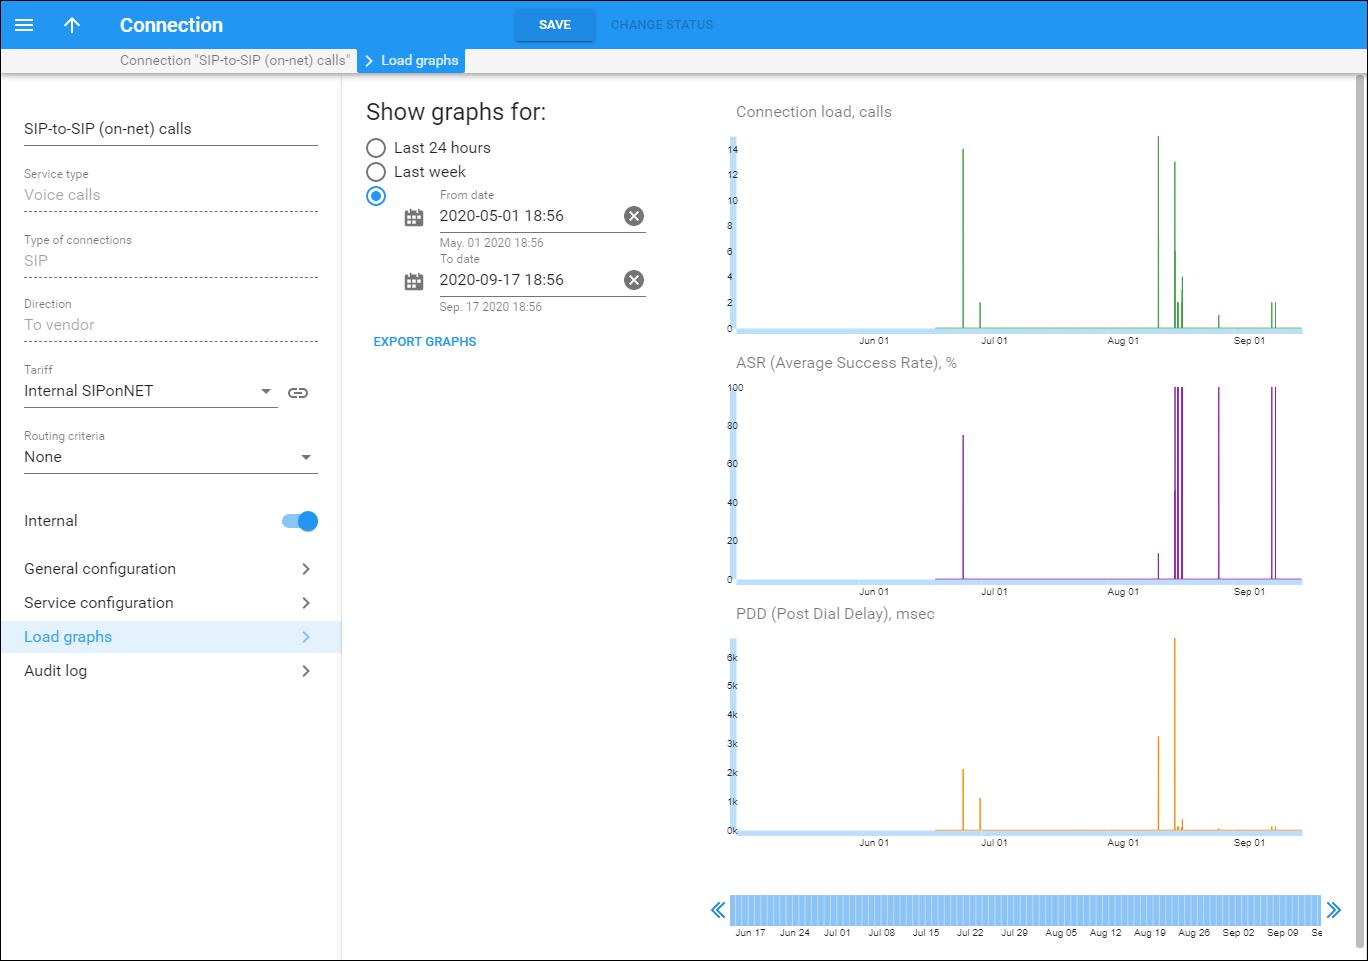
On this page, you can find the graphs showing the connection load, Post Dial Delay (PDD), and Average Success Rate (ASR) for the connection for the specified period.
The graph scale displays data at intervals of 15 minutes.
Show graphs for
Link copied to clipboard
You can select for which period to provide information.
- Last 24 hours (default)
- Last week
- To set a custom period:
- Click Calendar
to select the date and time or type it in the format YYYY-MM-DD hh:mm (2019-03-19 00:00).
- Click Calendar
Alternatively, you can set a period using the graph scale at the page bottom, e.g., March 1 – April 30.
How to download load graphs
Link copied to clipboard
To download graphs in the .pdf format for the selected period, click Export graphs.


