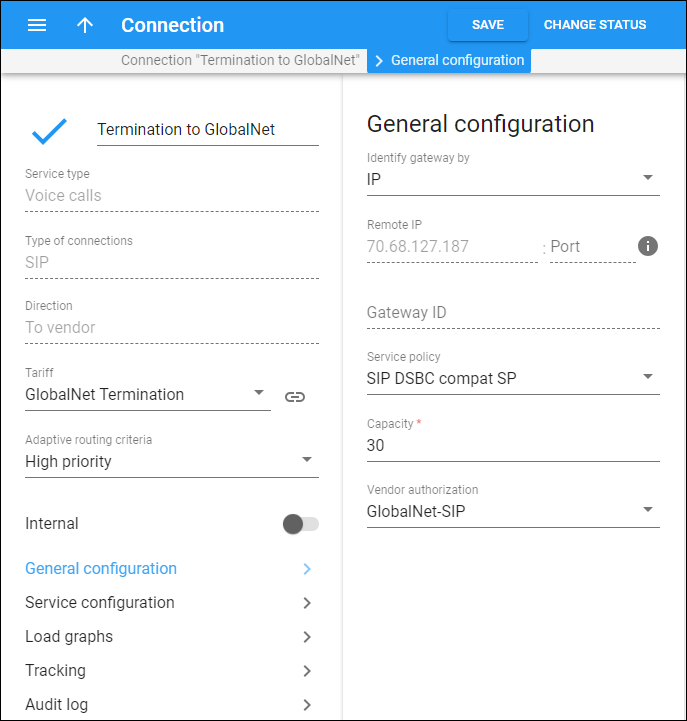
On this panel, you can view and change the connection details. Note that some fields are read-only. To save the changes, click Save.
Status
The Check mark ![]() shows that the connection is active. When the check mark is absent, the connection is inactive.
shows that the connection is active. When the check mark is absent, the connection is inactive.
To change the status of the connection, click Change status on the toolbar. Note that if you disable the connection (change the connection status to “Inactive”), new sessions won’t be established via this connection, but the current sessions will continue.
Name
This shows the connection name.
Service type
This shows the type of service that this connection transports.
Type of connections
This shows how the service between your vendor’s gateway and PortaBilling is transported.
Direction
This shows whether this connection is used to send or receive traffic to or from your vendor.
Tariff
This shows which tariff is used to charge you for transporting a service via this connection. Select the Tariff name to change a tariff. To narrow the search, start typing the tariff name.
Adaptive routing criteria
This shows the routing criteria that is applied to this connection. Select the Adaptive routing criteria name to change the settings.
Internal
When disabled, this shows that a connection is used to transport services to external networks. When enabled, it shows that a connection is used to transport services within your network.
General configuration
This section provides access to a panel that allows you to change settings such as gateway parameters, service policy, capacity and vendor authorization.
Service configuration
This section provides access to a group of panels that allow you to perform more specific configuration for this connection such as connection utilization, RTP proxying, translation rules, routing filters, etc.
This section appears for the Voice calls and Messaging services only.
Load graphs
This section provides access to the Load graphs panel that allows you to monitor connection load and quality parameters (e.g., ASR).


